Assessing the Flow Reduction of Low Impact Development Controls in a Residential Setting
Article information
Abstract
The widespread development in recent years has resulted in the expansion of impervious surfaces, allowing runoff to accumulate and cause flooding issues. To reduce the impacts of runoff accumulation, the concept of low impact development (LID) has been adopted to restore the hydrological balance of urbanized areas. The objective of this study was to assess the flow reduction of the LID combinations in a residential park in Cavite, Philippines using Stormwater Management Model (SWMM). The 90th percentile of historical rainfall from the years 1975-2019 was used in the assessment. The bioretention (BR), infiltration trench (IT), and permeable pavement (PP) LID controls, which captured 43%, 42%, and 14% of the park area respectively, were selected for implementation alongside their different combinations. Results of this study have shown that most LID scenarios reached their maximum reduction capability once it takes up around 20-40% of the total available area. The highest reduction, at around 90%, was attained by the BR+IT+PP scenario. The use of the PP scenario, however, only yielded a 20% flow reduction due to its small capture area. Implementing LID controls in urbanized locations can help in reducing runoff buildup, thereby alleviating the potential impacts of flooding.
Introduction
The increasing population, rapid urbanization, and conversion of natural spaces into impervious cover bring irreversible hydrological changes in urban catchments. Fluvial systems such as river channels are heavily impacted by these changes, modifying natural hydrological processes in the form of increased magnitude of peak discharges, decreased lag time, and increased runoff (Chin, O’Dowd, & Gregory, 2013). Studies have also noted that human activities can also result in alterations in sediment accumulation, water quality, channel geomorphology (Chin, O’Dowd, & Gregory, 2013; Ladson, 2019), and even stream taxonomy (Sheldon et al., 2019). With regards to flow regimes, heavily impervious catchments experience an increased runoff volume and frequency alongside increased number, peak, frequency, and magnitude of floods (Ladson, 2019). More severe flooding events from the aggregation of these various effects can also be expected given the changes experienced in the climate as well (Emilsson, 2021).
Low impact development (LID) is currently one of the emerging solutions in restoring the stream hydrology of these urban catchments to reduce the impacts of urbanization and its hydrological impacts (Bolisetti, Eckart, & McPhee, 2017). Given their capability to return watersheds to their predeveloped states, this can improve the overall infiltration, reduce runoff volume, reduce peak flows, and improve the water quality of receiving streams in the process (Hoban, 2019). Recently, modeling LID structures compared with postdeveloped has extensively been researched for its water quantity benefits, ranging from runoff (Yang et al., 2020; Luan et al., 2017), volume (Rong et al., 2021), peak flow (Guo et al., 2019; Li et al., 2020), and overall flow reduction (Rezazadeh et al., 2019).
The application and research of LID structures and naturebased solutions in developing countries, however, is currently not yet fully explored. The practice of urban drainage in developing countries has been said to be more complex than in developed countries due to varying socio-economic, technological, and climatic conditions (Rivard et al., 2006). Key urban water facilities such as sanitation, water supply, and flood hazard are supposedly in good condition in developed countries rather than in developing countries (Rivard et al., 2006), making it harder to prioritize newer and more sustainable drainage infrastructure. Research about the topic is also mainly contributed by developed countries such as the USA, UK, and China (Yang et al., 2017), where low productivity of developing countries has been attributed to socio-economic implications and a lack of funding resources (Maniquiz-Redillas et al., 2022). This lack of knowledge regards to this field could also hinder the formation of rational and cost-effective design principles, which include the size, location, and type of LID for application, its components, and allocations (Zhang & Chui, 2018) Furthermore, certain uncertainties also need to be that targeted in newer studies for design optimization (Gu et al., 2018). To address this research gap, the objective of this study was to assess the flow reduction of the LID combinations in a residential park in Cavite, Philippines using Stormwater Management Model (SWMM).
Materials and Methods
1. Study Area
The selected study area for this study is a residential catchment located in Bacoor, Cavite, Philippines (14°27′6.3432″, 120°56′48.264″), as shown in Figure 1(a). This residential vicinity was mainly composed of private houses and impervious roads, except for a small park area in the middle with sufficient green spaces for LID application. This park has an approximate area of 1100 m2 and was divided into six subcatchments as shown in Figure 1(b). From site investigation, it was deduced that the park was elevated from the road sections, and therefore only the park area was presumed to be captured by the proposed LID controls.
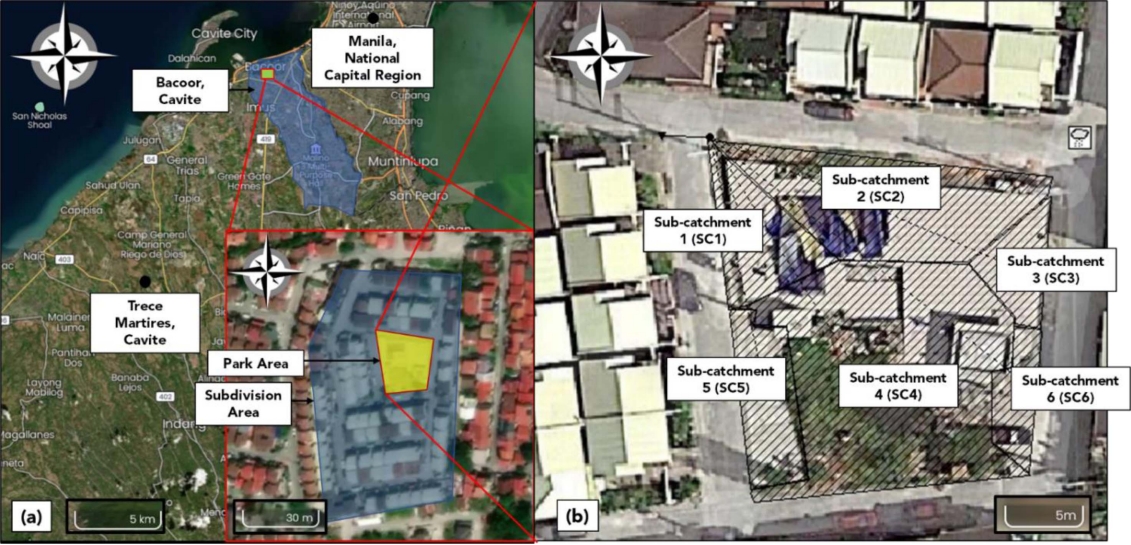
(a) Geographical location of the site and (b) sub-catchment distribution within the study area.
2. Rainfall Data
Rainfall data was taken from a local rain gauge approximately 6 kilometers away from the site. Daily rainfall records were collected for the years 1975-2019, although data for the years 1979, 1980, 1991, 2014, and 2015 were discarded due to incomplete yearly values. Since only daily rainfall was available for use, additional analyses were performed to redistribute these daily amounts into values that could be used in the hydrological model. This study used the Weibull plotting position, a probability distribution function to fit distributions in hydrology (Murugappan, Sivaprakasam & Mohan, 2017; Adeboye & Alatise, 2007), to obtain the 90th percentile of the collected rainfall for simulations. This 90th percentile of total rainfall was selected as it has been the standard for many LID manuals (EPA, 2009; Ministry of the Environment & Climate Change, 2016) and some studies (Frias & Maniquiz-Redillas, 2021; Garbanzos & ManiquizRedillas, 2022) for rainfall estimation in design. Equation (1) shows the Weibull distribution method formula.
Where P is the probability of occurrence, r is the rank number, and n is the number of observations.
3. Hydrological Model
The USA EPA SWMM was used in the assessment for LID simulations in this study. SWMM is a modeling tool for eventbased rainfall simulations commonly used in the determination of runoff and pollutant accumulation in urban catchments (Rossman, 2015). This software and its modifications have been a common choice for stormwater and low impact development-related research (Yang et al., 2020; Guo et al., 2019; Li et al., 2020; Rong et al., 2021; Wang et al., 2018; Baek et al., 2020) given that it offers various LID practices such as green roofs, swales, and rain barrels for modeling and simulation (Rossman, 2015).
4. Low Impact Development Schemes
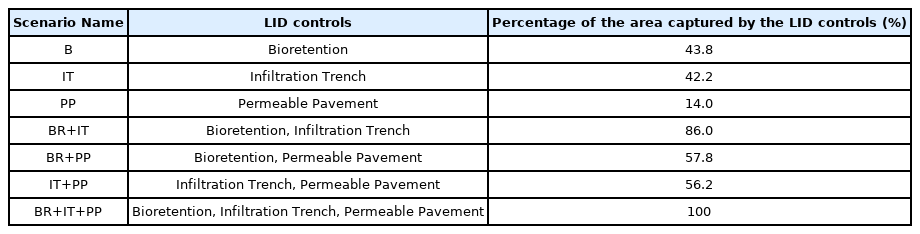
Three LID types were used in the study based on their availability in SWMM and their possible placement on site. The selected controls in the simulation include the infiltration trench (IT), bioretention (BR), and permeable pavement (PP) practices. Due to site limitations, the applied sub-catchments in the model were to occupy only one LID type: IT in SC1, SC2, and SC3, BR for SC4, and PP for SC5 and SC6. Their combinations were also assessed to determine the optimum combination considering outflow reduction, as summarized in Table 1. Varying surface areas were applied in each subcatchment for each scenario to determine the changes in reduction as the area increases, totaling about 505 total simulations. The maximum space that LID can be placed was represented in surface area over catchment area ratios (SA/ CA), where the values for the IT, BR, and PP were 0.65, 0.21, and 1.0 respectively.
Implemented LID scenarios for modeling using SWMM
Results and Discussion
1. Rainfall Characteristics
Figure 2 shows the scatterplot of the collected rainfall data. It was observed that more than 80% of all recorded events had daily rainfall of more than 25 mm excluding days without rainfall. Monthly statistics have shown that the lowest maximum monthly rainfall (105.8 mm) was observed during the summer months from February to April, while the largest (1596.7 mm) was seen during the rainy season, which typically lasts from May to October. This trend is representative of a Type I climate in the Philippines (DILG. 2011). On average, approximately 2100 mm of rainfall is experienced by the area per year. Since these were daily values, these were analyzed further using distribution and disaggregation methods for input in the model. Figure 3 shows the Weibull distribution analysis of the collected rainfall data. The Weibull distribution method performed showed that the 90th percentile of the 40-year historical rainfall was approximately 16.64 mm. This was then distributed over 24 hours using the triangle method as used by Frias & Maniquiz-Redillas (2021) and Garbanzos & Maniquiz-Redillas (2022) and was utilized as the sole rainfall scenario for all simulations.
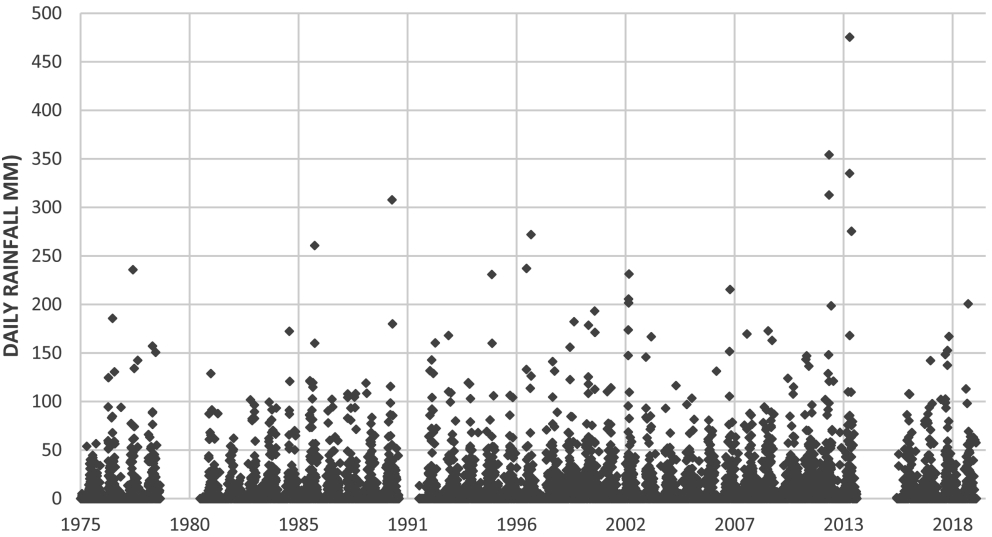
Scatterplot of daily rainfall data from 1975 to 2019.
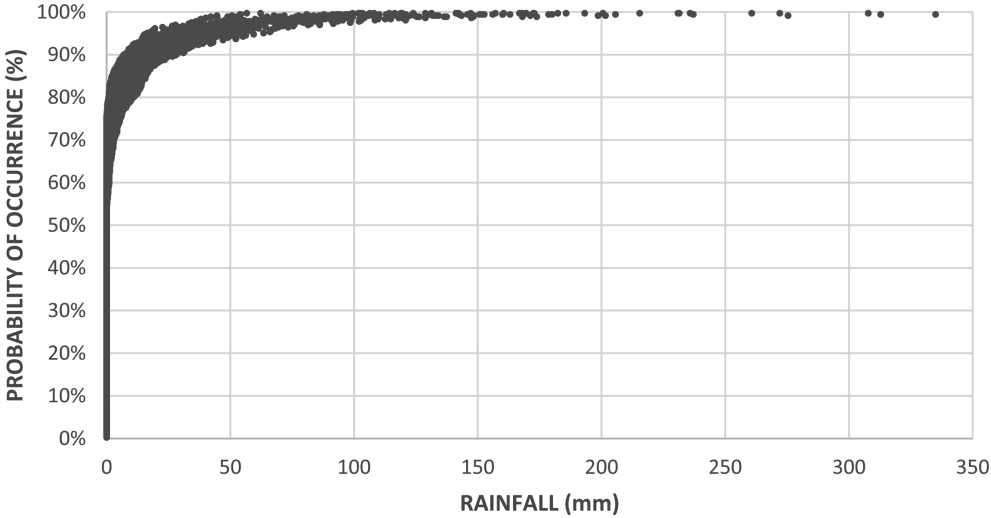
Probability of occurrence of the daily rainfall data (1975-2019) using the Weibull Distribution Method.
2. Pipe Outflow Reductions
Figures 4(a) to (e) show the relationship of the outflow reduction with the SA/CA ratio of each simulated scenario in varying surface areas. The best scenario with regards to outflow reduction was the BR+IT+PP scenario, peaking at a 91.8% reduction. Scenarios with more LID structures often get the best results as observed in other studies (Yang et al., 2020; Li et al., 2020; Rong et al., 2021) given that it can capture and store more of the incoming runoff. The PP-only scenario had the lowest reduction results from this study, likely due to its smaller capture area. Most of the scenarios from the simulations had their maximum reduction equal to the point of divergence of the linear graph and the stagnant plot. The only exception to this was the IT-only scenario whose maximum possible reduction was not attained due to insufficient space for the application.
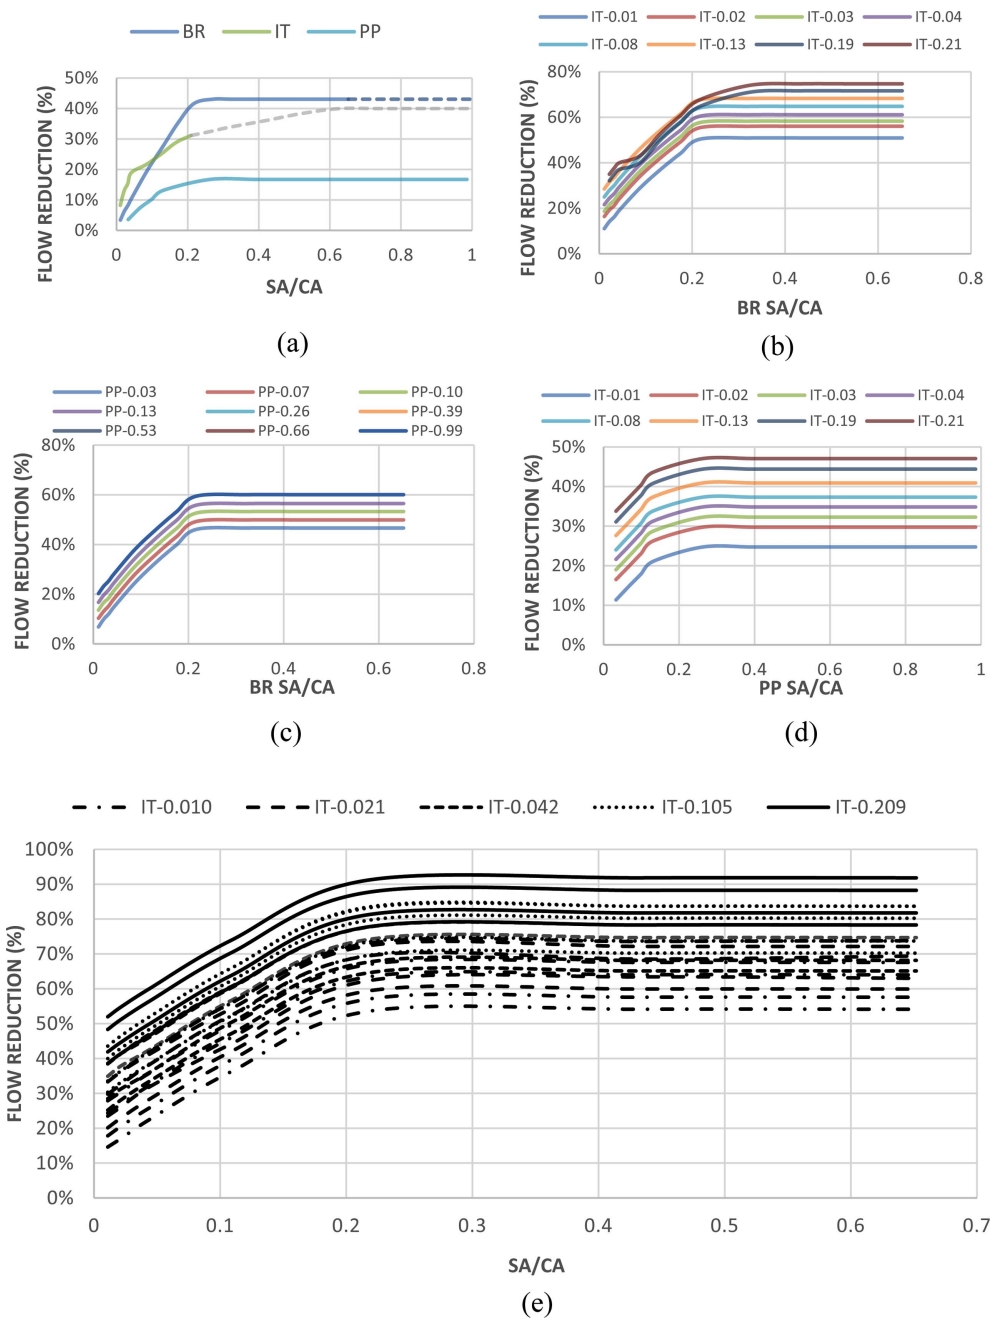
Flow reduction of the bioretention (BR), infiltration trench (IT), and permeable pavement (PP) combinations under varying surface area/catchment area (SA/CA) values: (a) single LID scenarios, (b) BR+IT scenario, (c) BR+PP scenario, (d) IT+PP scenario, and (e) BR+IT+PP scenario.
Common trends have also been observed from the reductions modeled in SWMM. In all 7 LID scenarios, there is a linear relationship between the flow reduction and SA/CA ratios at low LID sizes, until a certain point where the reduction stagnates. These points, which are usually observed in the 0.2 to 0.4 SA/CA range, are preceded by a horizontal plot that represents the LID’s maximum outflow reduction capacity within the sub-catchment. These points of diminishing returns are important to note in the LID design as targeting a larger SA/CA size over this point would be impractical and uneconomical.
3. Statistical Analysis of Pipe Outflow Results
Additional statistical analysis was performed on the given results for comparison of the LID scenarios and the implications of sizing within the study site. Figure 5 collectively compares the flow reduction of each LID scenario. Median values indicate that the BR+IT+PP scenario was the best regardless of size (median of 56.14%), followed by the BR+IT, BR+PP, BR, IT+PP, IT, and PP scenarios. Generally, single LID scenarios generated the lowest median results, although the BR control appeared to be a precursor for better reductions in the study site. This was due to its larger possible area on the park and its natural capability to reduce runoff volume, as reported in other studies (Wang et al., 2020; Jeong et al., 2016). Larger ‘boxes’ were also seen from scenarios with the BR, an indicator that even though the BR scenario generates better values, its potential range can also be lower than the other scenarios. The minimum flow reduction of the IT+PP scenario (11.35%) appeared to be the second-best result using minimum LID sizes, slightly higher than the BR+IT (11.08%) and BR+PP (6.85%) results. Median-wise, however, the BR+IT and BR+PP scenarios are better and more viable alternatives regardless of size to the BR+IT+PP scenario as their reduction medians are only 6% and 9% lesser than the most effective scenario, respectively.
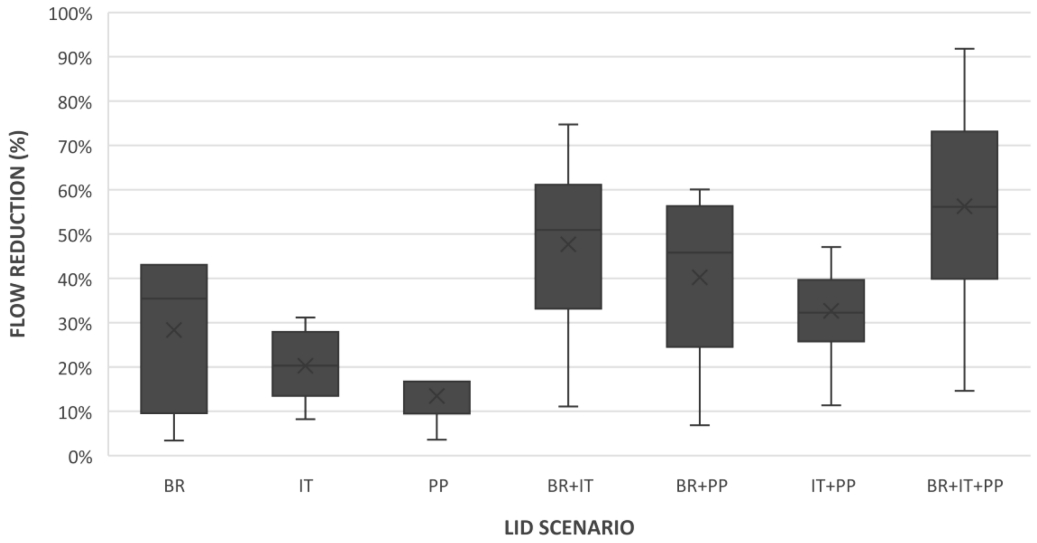
Box plot comparison of the LID scenarios concerning their flow reduction.
Table 2 shows the LID sizes to catchment size and estimated flow reduction values. Results depict that combination LID scenarios require lesser LID needed to attain certain flow reduction targets as opposed to single LID scenarios. This implies that decentralizing and using multiple controls is generally more effective at least in the study site due to the observed site characteristics. The site imperviousness, slopes, green spaces, and delineation in the model could have played a factor in the positive effects of LID distribution in the site area. There are cases, however, where the single LID scenario is better than the multiple LID scenario. Instances of this were observed in the 20% reduction of the IT and BR+PP scenario and the 40% reduction of BR and IT+PP. These differences were associated with the exclusion of the single LID scenario with the compared combination scenario, as it implies that some LID scenarios have high reductions despite having smaller areas, while others may have had plateaued values by the time it was compared to another scenario.
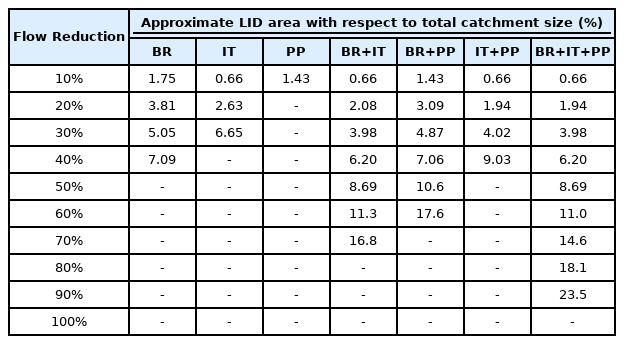
LID area with respect to catchment size at varying flow reductions
Focusing solely on the maximum reductions and their respective LID size also provides additional insight into the trend of LID application in the site area. Table 3 summarizes the LID sizes at the maximum reduction. Results from this assessment have shown that relatively small LID sizes were needed to attain the maximum reduction. These LID sizes at this maximum reduction mainly ranged from 0.2 to 0.4 SA/CA which suggests that there is sufficient space for LID application to get the maximum reduction of each scenario using the 90th percentile of rainfall. In all scenarios that contained the BR, whose maximum SA/CA ratio is around 0.68, around half of the area was only required to get the best reductions. This was similar to scenarios containing the PP scenarios, which needed less than half the area to get listed values (max SA/CA at 1.0). On the other hand, maximizing the space for the IT was needed for all observed scenarios given that only a portion of the sub-catchment space was available for LID implementation. This further expounds on the importance of location as a component for LID design and allocation, as stated by Zhang & Chui (2018).
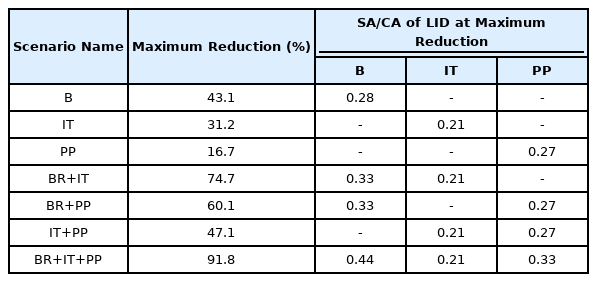
Sizes of LID controls at maximum outflow reduction
In comparing the LID sizes applied on site, results have been separated into three ranges based on the ratio of the total LID area over the catchment area: the 0-0.125 range, 0.126- 0.25 range, and the 0.26-0.50 range. Figure 6 shows the box plot comparison of the simulated scenarios grouped by the range of area, with the largest possible LID area on site at 0.50. Results have shown that there the first range (0-0.125) had large differences from the other ranges, having a median that is 34% lower than the 0.125-0.25 range and 41% lower than the 0.26-0.50 range. This is representative of what is observed in Figure 3a-e, where smaller LID sizes mainly constituted low reduction values. The range of 0.126-0.25 to 0.25-0.50, however, was closer to one another, having a median of 56.37% and 71.59% for the two ranges respectively. The upper extremes of each plot were also similar between the two segments. The upper quartile of the flow reduction was approximately 57% and 72% for the 0.126-0.25 and 0.26 -0.50 ranges respectively, and a maximum reduction of the two peaks at 91%. Comparable results between the two dictate that it may be more cost-effective to construct lower sizes rather than maximizing the space for LID application. The selection of the optimal sizes and scenarios, however, is not solely based on its hydrological performance as other aspects such as imperviousness of the area (Le Floch et al., 2022), cost (Li et al., 2020; Rezazadeh et al., 2019), and water quality (Wang et al., 2018; Baek et al., 2020, Rong et al., 2022), may be significant to the planning process as well.
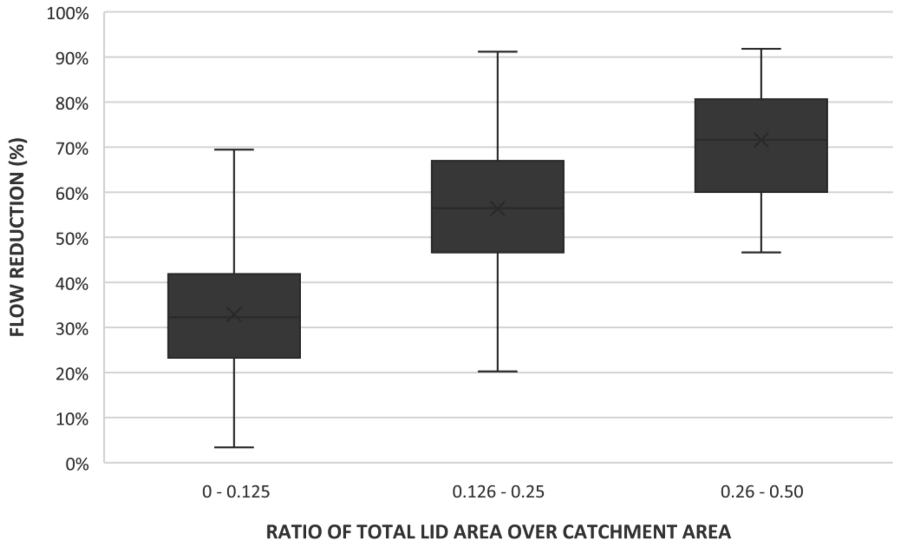
Box plot comparing the flow reduction and total LID area over catchment area at given ranges.
Conclusion
The application of LID controls, namely the bioretention, infiltration trench, and permeable pavement practices, in the residential park managed to reduce the accumulated outflow from its current arrangement. All modeled scenarios exhibited similar trends where the reduction and SA/CA ratio maintained a linear relationship up to a certain point. From the simulated combinations, this outflow reduction can peak at 91.82% with the utilization of all three structures. Small LID sizes not exceeding 50% of each sub-catchment were needed to get the best reduction values in all scenarios. While the combination of all three controls generated the best results from this assessment, the optimal arrangement is still dependent on various parameters such as its impacts on the overall water quality, its capital and operational costs, and even its effects on sediment accumulation. Furthermore, assessing the outflow reductions in larger rainfall amounts may result in different trends as well. Utilizing LID structures in impervious areas can help in reducing the impacts of untreated runoff.