The Impact of Theme Park Experience on Satisfaction and Loyalty
Article information
Abstract
Theme parks have become more successful in recent years. Furthermore, theme parks have grown in popularity as urban leisure destinations and tourist attractions that offer visitors a variety of experiences. Understanding visitors' interactions in the theme park is important because customer satisfaction and loyalty are heavily influenced by their experiences. The study's goal was to determine the impact of theme park experience on satisfaction and loyalty. Specific objectives were to describe the respondents’ demographic profile, determine the respondents’ perceptions toward their theme park visit in terms of theme park experience, theme park satisfaction, and theme park loyalty, establish a significant difference between the respondents’ profile and their perception towards theme park experience, theme park satisfaction, and theme park loyalty, and establish a significant relationship between the respondents’ perception towards their theme park experience and their theme park satisfaction and theme park loyalty. This study adopted the descriptive-correlational method.The survey was completed by 389 visitors who had visited the three major theme parks in the Philippines during the past few years. The research used a combination of convenience and snowball sampling in order to reach all respondents during the pandemic. The statistical tools used were frequency counts, percentages, mean, chi-square, and Spearman’s rank correlation coefficient. It can be gleaned from the study that theme park visitors' satisfaction is based on their happiness with all their experiences in the theme park. The key findings demonstrated that theme park experience, theme park satisfaction, and theme park loyalty are significantly and positively related to respondents’ assessments when visiting theme parks. The results suggest that theme park operators and management should focus on maintaining a good physical setting that will entertain and satisfy theme park visitors.
Introduction
Among the world's most important industries is tourism, with direct economic effects on a variety of sectors including transportation, lodging, food service, entertainment, and destinations. Throughout the years, the industry's growth has been gradually growing (Global Tourism Industry-Statistics and Facts, 2018).
Tourism has a significant impact on a country's growth. It contributes to and provides for a country like the Philippines, which is blessed with numerous islands, provinces, and regions with beautiful scenery and picturesque views. With its many scenic views, the Philippines is a "fantastic location" for theme parks (Trowbridge, 2018). Theme parks have become prominent visitor attractions and urban leisure destinations. As a result, theme parks have become popular forms of mass entertainment all over the world (Milman, 2015).
Sustainability in theme parks is an important and increasingly prevalent topic, as these entertainment destinations face unique challenges and opportunities when it comes to integrating sustainable practices into their operations. The impact of sustainability in the theme park experience can have profound effects on visitor satisfaction and loyalty. Sustainability efforts in theme parks can enhance the overall guest experience, leading to higher levels of satisfaction and increased visitor loyalty.
It is extremely necessary to understand customer experience towards theme parks, their satisfaction, and loyalty for designing services and goods to offer. Theme parks involves a commitment to creating a positive social impact on visitors, employees, and the communities in which they operate while promoting inclusivity, diversity, and responsible business practices. Incorporating the understanding of customer experience, satisfaction and loyalty into operations is a key success factor in theme park operations.
1. Literature Review
Theme parks are a relatively new type of leisure activity that creates a fantasy environment of another place and period (Milman et al., 2012). These entertainment attractions are pioneers in the growing experience economy and "remain at the vanguard of innovative design, marketing, and delivery of unforgettable experiences" (Geissler and Rucks, 2011).
The theme park has expanded in recent years and gained popularity among visitors from all over the world. There has also been a steady rise in the population of people visiting theme parks and tourist attractions. Theme parks are important tourist attractions that pique the interest of tourists and provide enjoyable experiences. In terms of new technology, the theme park industry is slowing after decades of steady expansion, and it is facing other leisure and tourism items which compete with each other. Theme parks must enhance the visitor experience and make parks more sustainable in order to compete in a market that is becoming more competitive (Dong et al., 2013).
According to Dong and ManSiu (2013), as the market for personalized services such as theme parks increases, so does the importance of managing those experiences. As a result of the moderating effects of consumer characteristics, there is a correlation between the servicescape and visitor assessment in theme parks. As a result, the servicescape's substantive and communicative aspects correctly predicted visitors' scores. In addition, a servicescape element's capacity to create a good customer service experience was found to be affected by the proclivity of visitors to fantasize and/or engage.
Theme parks are popular tourist attractions because they provide a sense of adventure and imagination, stressing visitors' emotions are elicited by hedonic and pleasurable encounters and service setting plays a valuable role in the development of tourist experiences (Ma et al., 2013).
Theme parks are famous tourist attractions that pique visitors' interest and provide unforgettable experiences (Ma et al., 2013). The theme park market, in terms of new technologies, is slowing down after decades of steady growth, and for other leisure and tourism goods, it is facing competition. Theme parks must improve the experience of visitors and increase the competitiveness of parks in order to thrive in an increasingly competitive market. “Crowding is a widespread problem in theme parks, a major source of disappointment among visitors” and a deciding factor in their decision to visit (Brown et al., 2013).
Customer experiences are crucial for tourism experience providers with a solid basis since customers perceive these experiences to be the main product (the "bundle of memories" that they take away with them). Customer experiences are also mentioned as a critical aspect that influences customers' inclination to repeat the experience or suggest it to friends or colleagues (Slatten et al., 2011; Marcinkiewicz, 2017).
Customer satisfaction can provide companies with information to streamline their operations and focus improvement programs on achieving cost efficiency to ultimately achieve better performance (Ilieska, 2016). Customers who are satisfied will return to purchase and spread positive word of mouth (Pham and Ahammad, 2017), influencing customer loyalty (Choi and Kim, 2013). To remain competitive, it is important to meet customers' demands and desires in order to retain their loyalty.
Customer satisfaction may occur when expectations are met and exceeded. However, expectations vary among different people. For example, a product may be highly appealing to one customer and not impress another at all, so each person’s degree of satisfaction is not congruous (Reynolds, 2018). Rather than attempting to affect customer loyalty solely through the products carried, businesses might more effectively garner consumer loyalty by learning more about what their customers appreciate and value and working to meet those expectations.
According to Mugito (2016), customer loyalty is a deeply helpful commitment to revisit an accommodation facility in the future consistently, despite situational and marketing efforts that have the potential to cause switching behavior. Therefore, if customer relationship determinants are perceived as positive by the customers and are found to benefit them, then the loyalty will be realized as they reciprocate to the theme park facilities.
Wonderful experiences can be considered a critical factor of client loyalty; the wonderful experiences are derived from contentment, which leads to a good behavioral attention consequence following the joyful experience (Ali et al., 2018). Dissatisfied tourists will urge them to go on to other places in the future, therefore encouraging people to return is an important component in determining the theme park's future. In the future, decisions may be made about the need for upgrades to the theme park's ambience, which would increase visitors’ level of satisfaction throughout their activity experience and, as a result, increase loyalty to the individual theme park, according to Qu Kangli (2017).
Theme park management must take customers' satisfaction and loyalty seriously in order to maximize profit while also retaining existing customers and attracting new target customers (Loke, 2017). Knowing the level of satisfaction of customers with the experiences provided creates a win-win situation, as it meets their requirements and wants while also allowing the theme park to increase their quality of service and management to further satisfy customers (Meyer and Meyer, 2016; AlAli, 2016).
The main objective of the study was to examine the relationship between theme park experience, theme park satisfaction, and theme park loyalty. Specific objectives were:
1. To describe the respondents’ demographic profile in terms of:
1.1. Age
1.2. Sex
1.3. Civil Status
1.4. Highest Educational Attainment
1.5. Monthly Income
1.6. Occupation
2. To determine the respondents’ perceptions toward their theme park visit in terms of:
2.1. Theme park experience;
2.2. Theme park satisfaction; and
2.3. Theme park loyalty
3. To establish a significant difference between respondents’ profile and their perception towards the following:
3.1. Theme park experience;
3.2. Theme park satisfaction; and
3.3 Theme park loyalty
4. To establish a significant relationship between the respondents’ perception towards their theme park experience and their:
4.1. Theme park satisfaction
4.2. Theme park loyalty
2. Null Hypotheses
Hₒ1 There is no significant difference between respondents’ profile and their perception towards their theme park experience, theme park satisfaction, and theme park loyalty.
Hₒ2 There is no significant relationship between the respondents’ perception towards their theme park experience and their theme park satisfaction;
Hₒ3 There is no significant relationship between the respondents’ perception towards their theme park experience and their theme park loyalty.
The study focused on determining the experience, satisfaction, and loyalty of theme park visitors through profiling their demographics and an assessment of theme park experience, satisfaction, and loyalty. Responses were based on the respondents’ experiences. The respondents were comprised of visitors who had previously visited the theme parks at the time of the study. The study determined the relationship between visitor experience, satisfaction, and loyalty. It limits its number of theme parks to the top three most visited theme parks in the Philippines during the time of the study.
1.3 Research Paradigm
The present study is based on a similar study of Qu (2017) that assessed the influence of experience on satisfaction and intention to return to theme parks. This study focused mainly on visiting-respondents’ theme park experience, satisfaction, and loyalty. It determines age, sex, civil status, highest educational attainment, monthly income and occupation are all part of the profile of the visiting-respondents.
Figure 1 shows the research paradigm; each set of profiles was tested for their relationships. The respondents’ demographic profile was tested for correlation with the respondents’ assessment of their theme park experience, satisfaction, and loyalty. The same test was also applied in determining the significant relationship between theme park experience, satisfaction, and loyalty.
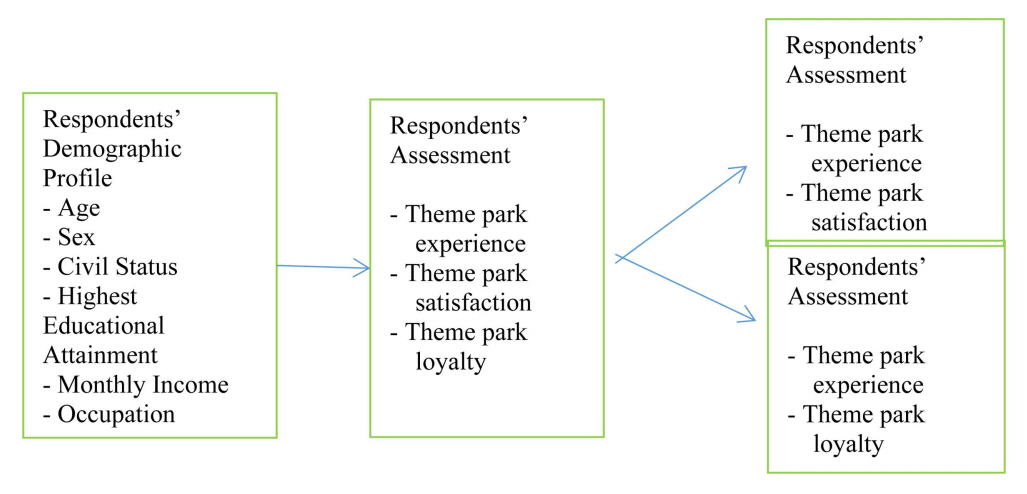
Paradigm of the Study.
Methodology
A descriptive correlational research method was applied to the study since it focused on describing the profiles of the respondents and the relationship between their theme park experience, satisfaction, and loyalty.
The respondents of the study were visitors who had visited the three theme parks in the previous years. The participating theme parks are the top three (3) most visited theme parks in the Philippines. The research used a combination of convenience and snowball sampling in order to reach all respondents during the pandemic. The sample size of 389 was determined using Raosoft.com.
The basis of the questionnaire was the study of Kangli Qu (2017). A few adjustments were made to the instrument to cater to the population of the study, and the instrument was used to the top three (3) theme parks in the Philippines based on the recommendations of the research adviser and further evaluated by three theme park industry experts. Some items were added and the remaining questions were adopted changing some of the phrases and statements, and merging some of the questions and alteration of the Likert scale used in the questionnaire was made.
The survey questionnaire has five (5) parts. The first part was intended to determine the demographic profile of the respondent such as age, nationality, sex, civil status, monthly income, highest educational attainment, and occupation. The second part intends to know the profile of respondents when visiting theme parks, in particular, items related to place of origin, the most recent theme park they have visited, purpose of visiting the theme park, frequency of visit in the theme park, and their companions when visiting a theme park. The third part determines the respondents’ theme park experience. The fourth part is to know respondents’ theme park satisfaction. The fifth and last part is on determining respondents’ theme park loyalty. The profile of the respondents was adjusted and separated from their perceptions of their theme park experience, satisfaction, and loyalty on the instrument to be understood by the respondents without further explanation of the questions and to allow the respondents to reply independently to the survey questionnaire without any influence from the researcher. The Likert scale was likewise adjusted to a six-point likert scale. The researcher opted to consider the six-(6) point Likert scale. Since the response scale has an even number of objects, it can provide groupings that are easier to understand and discuss (Thompson, 2018).
The questionnaires were distributed using Google forms via online survey. The online survey questionnaire is developed using an instant program and sent electronically via email or to any of the target respondents’ social media sites along with the letter of introduction. The data gathered was analyzed using descriptive statistical tools such as frequency counts, percentage, mean, chi-square, and Spearman's Rank Correlation Coefficient.
Table 1 shows the Likert Scale Descriptive Equivalent to have a clear description of the respondents’ theme park experience, satisfaction, and loyalty.

Likert Scale Descriptive Equivalent.
Findings and Discussions
Table 2 results showed that the majority of the respondents (203) were under the age of 20, accounting for 52.2% of the overall sample size; 51.2% were female, and 73.5% were single. The respondents are mostly college students, with 49.9%, and also presents the 49.6% of students with no income. This demonstrates that most of the respondents are from generation Z, with only minimal differences between the sexes. It also indicates that most respondents are well educated, employed and can afford to visit theme parks.
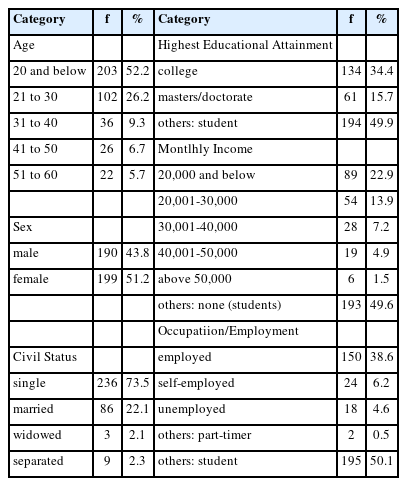
Socio Demographic Profile of Respondents’ Visiting Theme Parks.
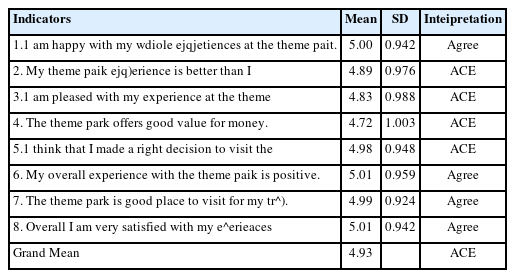
Table 3 presents the respondents’ assessment of their theme park experience. It can be observed that all of the responses are in agreement to a certain extent to the indicators.

Assessment of Respondents’ Theme park Experience.
Moreover, the respondents agreed to a certain extent that they look for a theme park that will give them total experience, to learn, to entertain, to imagine being someone else, to escape from reality or just to enjoy being at the theme park. It demonstrates that respondents rate the theme park primarily based on their overall experience and value, value and variety, park quality, and atmosphere. According to the study Dong and ManSiu (2013), “Through the moderating effects of customer predispositions, there is a link between the servicescape and tourist evaluation in theme parks”. Furthermore, it was discovered that a visitor's proclivity to fantasize and/or participate influences the ability of servicescape elements to shape a positive service experience.
Table 4 reveals the respondents’ assessment of theme park satisfaction. It can be observed that most of the responses are in increasing agreement to the indicators.
Assessment of Respondents’ Theme Park Satisfaction.
Respondents are in increasing agreement that they assess theme park satisfaction based on their personal observations, decisions, and experiences. Respondents will be satisfied if they are happy with their overall theme park experience, if their overall theme park experience is positive, if the theme park is a good place to visit for their trip, and if they are satisfied with their overall theme park experiences. There is a good chance that respondents are looking for enjoyable experiences at the theme park.
The grand mean for theme park satisfaction is 4.93 with an interpretation of “agree to a certain extent”. The results indicate that the respondents are looking for a theme park that will satisfy their overall experience. The respondents considered all the indicators important for them to meet their satisfaction. The guests were pleased with various aspects of their experience, including the positive effect experience, positive value perceptions, and short wait times. Excellent core products, quality food and beverage, servicescape, pricing decisions, and low visitor demand or sensible admissions policies were all root causes that influenced customer delight. Customers report that the physical environment, interactions with staff, and interactions with other customers all have a significant impact on both customer delight and satisfaction (Torres et al., 2018).
Table 5 presents the respondents’ assessment of theme park loyalty. It can be observed that all of the responses are in agreement to a certain extent to all the indicators.

Assessment of Respondents’ Theme Park Loyalty.
Moreover, the respondents agreed to a certain extent that theme park loyalty is one of their considerations in planning their theme park visit. The data also revealed that respondents agreed to a certain extent that they had plans to return to the theme park. The loyalty level and intentions of tourists vary depending on their emotional response. It is a method of comprehending how to create positive customer experiences (Ma et al., 2015).
The grand mean for theme park loyalty is 4.88 with an interpretation of “agree to a certain extent”. The outcome indicates that respondents intend to return to the theme park. It indicates that respondents are looking for a theme park to enjoy and appreciate a visit in a comfortable and leisurely environment. Customer satisfaction and loyalty were both influenced by customer delight. “To ensure that their customers have a delightful experience, theme parks must maintain a good physical setting, manage their human resources well, and manage the behavior of other customers” (Ali et al., 2018).
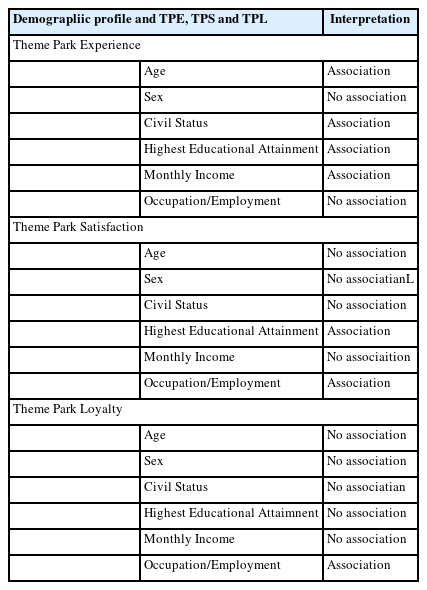
Table 6 could be a good indication of gender equality when it comes to visiting theme parks. There was no association observed in the respondents’ occupation with a p-value of 0.308. This may mean that visitors’ opportunity to visit a theme park has to do with the line of work they have and that no relationship is seen as the purpose of their visit. Employees are sometimes required to go to places where they need to perform their tasks while on business trips, regardless of their preference for or aversion to visiting certain places (Bennette, 2014).
Association between Respondents’ Socio-Demographic Profile and their Theme Park Experience, Theme Park Satisfaction and Theme Park Loyalty.
It also reveals the relationship between the respondents’ socio- demographic profile and their satisfaction with theme parks. It can be seen that among the respondents’ socio demographic profile used as indicators, highest educational attainment and cccupation, with p-value of 0.041 and 0.003, respectively, have realtionships with respondents’ theme park satisfaction. The result may be due to the knowledge and experiences they have and their spending capacity to go to different places they want. This is probably due to the workloads of the respondents. They tend to unwind after a long, tiring day by indulging themselves by doing different activities or travelling. According to Bakker (2011), employees who are engaged in their work are completely devoted to their jobs. They are brimming with energy, committed to their work, and engrossed in their daily activities. Employees who are engaged are more open to new information, more productive, and more willing to go above and beyond.
Table 6 also shows the relationship between the respondents’ socio-demographic profile and their theme park loyalty. It can be seen that among the respondents’ socio demographic profile used as indicators, occupation with p-value of 0.044 has a relationship with respondents’ theme park loyalty. The rest of the respondents’ socio demographic profile indicated in the study; age, sex, civil status, highest educational attainment and monthly income have no significant relationship to the respondents’ theme park loyalty. This may imply that in the globalized world today, and with the ease of access to different places through social media, almost all age groups, male or female, single, married or widower; educated or not, making it one of the most effective tools in marketing any product, including tourism industry products since it is being used as a medium for information (Westerman et al., 2014).
The chi square test of independence yielded the following results for the three theme parks: theme park experience, theme park satisfaction, and theme park loyalty are associated with some demographics, such as age, civil status, educational attainment, monthly income, and occupation. The higher the sample population, the greater the variability it possesses. In terms of age, the younger generation tends to have favorable experiences, satisfaction, and loyalty as compared to those who belong to the older generation.
Table 7 shows the correlation between theme park experience, theme park satisfaction, and theme park loyalty. The Spearman’s rho correlation revealed that theme park experience and theme park satisfaction as well as theme park experience and theme park loyalty have a positive moderate correlation (Spearman’s rho = 0.586, p = <0.001; Spearman’s rho = 0.601, p = <0.001). This signifies that theme park experience, theme park satisfaction and theme park loyalty are major considerations when visiting a theme park. When visitors engage with their activities at the theme park, they can also easily be satisfied with their theme park visit as well as their revisit intention. This result is supported by the study of Qu (2017) that experience has an impact on customer satisfaction. Using the experience economy, it creates a scale to measure customer experience and satisfaction. “It discovered that the dimensions of experience can be used to predict satisfaction. Several other studies have claimed that experiences have an impact on satisfaction” (Song et al., 2015). Additionally, Radder and Han (2015) discovered that edutainment (the experience of combining education and entertainment) is the most important experience dimension in determining visitors' intention to return. It also reveals that a positive previous experience is a strong predictor of future visits.

Relationship among Theme Park Experience, Theme Park Satisfaction and Theme Park Loyalty.
When customers have a favorable experience visiting theme parks, they tend to express favorable satisfaction, manifested concretely through positive customer satisfaction ratings. The level of relationship is moderate based on the matrix presented. On the other hand, customers who have registered an unfavorable theme park experience tend to also manifest unfavorable customer satisfaction ratings. Likewise, with favorable theme park experience, customers tend to have greater loyalty manifested through the greater frequency of visits to the theme park. Overall, a positive moderate relationship resulted in the analysis.
The bigger the population, the more statistical power the test would be. The greater the variability, the greater the likelihood of failure.
To some extent, the respondents agreed that they visit theme park to greater understanding, to have learned a great deal at the theme park, to stimulate their desire to learn new things, to have a genuine learning experience, to be amused with the theme park activities, to be captivated while watching performances, to be entertained with the theme park activities, to have fun, to feel a different character in the theme park, to experience living in a different time or place, to imagine of being someone else, to completely escaped from daily routine, to experience a genuine sense of harmony, it's enjoyable just to be in a theme park, that the theme park setting is very appealing, and that the theme park setting places a high value on design details.
The respondents are in agreement that they are satisfied with their theme park visit if they are pleased with the whole experience in the theme park, that their theme park overall experience is positive, that the theme park is a good place for them to visit during their trip. and their overall experiences at the theme park. They have agreed to a degree that they are happy if their theme park experience exceeds their expectations, that they are pleased with their theme park experience, that the theme park provides good value for their money, and that they made the right decision to visit the theme park.
A majority of respondents decided that the theme park will be their first choice in the future, that they will visit the theme park again, and that they plan to visit the theme park if they return to their destination.
Data revealed a relationship in age, civil status, highest educational attainment, and monthly income when assessing a meaningful relationship between the respondents' socio-demographic profile and their theme park experience. It is clear that sex and occupation have no relationship in the profile.
The data revealed relationships in highest educational attainment and occupation when identifying the remarkable relationship between the respondents' socio-demographic profile and their theme park satisfaction.It is clear that age, sex, civil status and monthly income have no relationship with the profile.
In analyzing the notable relationship between the respondents’ socio demographic profile and their theme park loyalty, data revealed relationships in occupation. It can be observed that age, sex, civil status, highest educational attainment and monthly income have no relationship with the profile.
The Spearman rho correlation revealed that theme park experience and theme park satisfaction, theme park experience and theme park loyalty are significantly and positively related with respondents’ assessment when visiting theme parks.
Figure 2 reveals a correlation between theme park experience and satisfaction, with high experiences correlated with higher satisfaction levels. The graph clusters dots, indicating a pattern where visitors with high experiences tend to have high satisfaction levels.
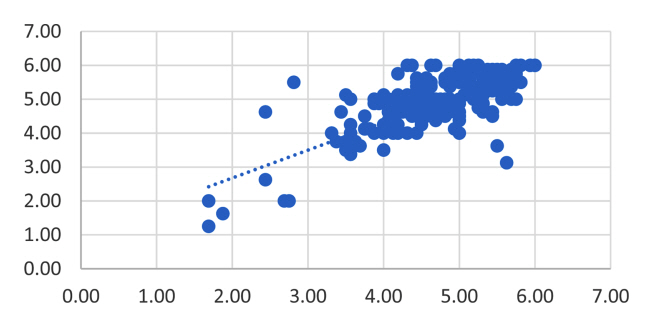
Scatter Plot Relationship between Theme Park Experience and Theme Park Satisfaction.
Figure 3 reveals the relationship between visitor's experiences at theme parks and their loyalty. The graph shows how different levels of theme park experiences affect loyalty. Positive experiences at theme parks are more likely to lead to loyalty. This information can help theme parks improve customer satisfaction and retention by identifying the most important aspects of customer experiences in building brand loyalty.
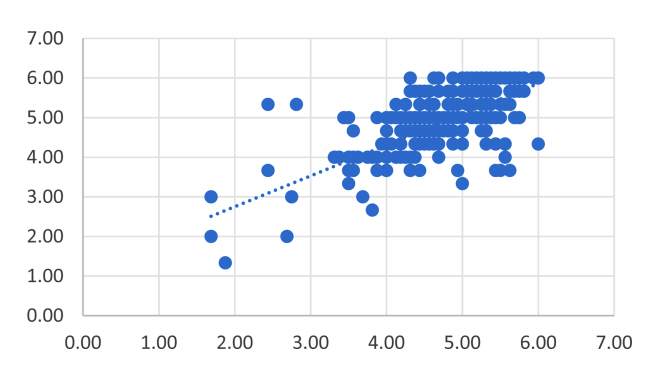
Scatter Plot Relationship between Theme Park Experience and Theme Park Loyalty
Conclusion
From the summary of the findings of this study, the following conclusions were drawn:
Theme park visitors today are young and educated who are willing to spend money on their visit. Theme park visitors primarily want to learn a lot, to stimulate curiosity to learn new things, to have a real learning experience, to be entertained, to have fun, to play a different character, to live in a different time and place, to imagine being someone else, to completely escape from daily routine, to feel a real sense of harmony, to be pleasant while being in the theme park, to have a setting that is very attractive, and a setting that focuses on design details.
Theme park visitors' satisfaction is based on their happiness with all their experiences in the theme park that their overall impression of the theme park is favorable, that the theme park is a pleasant place to visit for their trip and their overall theme park experience.
Theme park visitors' age, civil status, highest educational attainment, and monthly income have a major relationship with theme park experience, while their sex, and occupation have no such relationship. Theme park visitors’ highest educational attainment and occupation have a significant relationship with theme park satisfaction and that theme park satisfaction in general has no relationship with their age, sex, civil status, and monthly income. More so, the occupation of theme park visitors has a significant relationship with theme park loyalty, and age, sex, civil status, highest educational attainment, and monthly income have no relationship with theme park loyalty in general.
Theme park experience, theme park satisfaction, and theme park loyalty are significantly related with each other.
Recommendations
This study was able to determine relationship or relationship with its variables, but it is recommended that future researchers conduct a study that would determine the level of relationship among each of the variables presented. A deeper understanding of this may add further assistance to the theme park management to create a positive and inclusive environment for both visitors and employees while benefiting the surrounding community. This can include: 1. Inclusivity: Ensuring that the park is accessible and enjoyable for people of all ages, backgrounds, and abilities 2. Local Community Engagement: Collaborating with local community to support economic development, provide job opportunities, and contribute to local culture and heritage 3. Education and Awareness: Offering educational programs within the theme park that promote environmental and social responsibility, as well as encouraging visitors to engage in sustainable practices 4. Community Benefit: Providing benefits to the local community 5. Safety and Security: Ensuring the safety and security of both visitors and employees.
In summary, sustainability in theme parks not only benefits the environment but also has a significant impact on visitor experience, satisfaction, and loyalty. When theme park successfully integrate sustainability into their operations and provide guests with engaging, educational, and ethical experiences, they are likely to build stronger relationships with their visitors and thrive in a competitive industry. Sustainability and guest satisfaction go hand in hand, leading to a win-win scenario for theme parks and their environmentally conscious guests.