

Introduction
Climate change has caused water resource becomes more uncertain whether in space and time which in turn affects the availability of irrigation water. Since then, increasing the efficiency of irrigation water has drawn more attention. Precision farming with smart irrigation is an important endeavor to meet the actual water need by the crop.
There are techniques (drip, sprinkler, etc.) available to supply the irrigation water efficiently though most of them rely on sensors to detect soil moisture or water potential, which is not representing the rate of water consumed by the crop, or crop evapotranspiration (ETc). ETc known as the most determining component of water balance in the soil-plant-atmosphere system (Consoli and Vanella, 2014) which is highly dependent on weather, plant variety and maturity. It is not easy for these techniques to meet ETc neither in time nor quantity.
Literally, crops absorb the water effortlessly when the soil moisture in the root zone is at the readily available water (RAW) which is somewhere between the field capacity (FC) and permanent wilting point (PWP) (Dewi et al., 2020). Practically, it is not a simple task to maintain RAW since the water from the soil surface takes time to reach the root zone while ETc fluctuates uncertainly with time.
Water productivity (WP) is important indicator to judge how the water supplied contribute to the crop production (Hinai and Jayasuriya, 2021). There are 2 types of WP resumed here as follows (Muharomah et al., 2020):
In which, subscripts p for physical and e for economical. Herewith, R is rainfall, WPp denotes the contribution of ETc to the weight of the dried biomass (Wd), WPe denotes the contribution of irrigation water (Q) to Wd, and WUE is the water use efficiency (%) (Sun et al., 2006). The unit of R and Q is liter (L), the unit of Wd is gram (g), and the unit of WPp and WPe is g/L.
While WPe may highly fluctuate with season, WPp is more stable and thus becoming a valuable indicator for comparison among different irrigation techniques. The highest WP is reached when Q meets with ETc, or Q = ETc which should be the set target of any irrigation practice. Thus, any deviation of Q toward ETc will reduce WP. Higher WUE can be attained when the incoming water timely distributed uniformly over the fields (Hassan-Esfahani et al., 2015), and contribute directly to WPe and WPp (Fuadi et al., 2016; Sirait et al., 2015). Rationalizing the water supply at a certain level can increase WP (Hasanah et al., 2017).
Smart irrigation system can indeed improve WP but is highly relies on electricity and instrumentations which are rarely available in the real fields (Gonz├Īlez Perea et al., 2016). Instead, a simpler cost-effective irrigation manageable by farmers is essential (Wang et al., 2021) which can support the farmer-lead irrigation development (FLiD). Under FLiD, a preferable irrigation technique should be less burden on public finances, faster process to implement and spreading more benefit (P)1.
There are various types categorized as unpowered irrigation driven by the natural ETc process. To date, pitcher irrigations can meet ETc precisely and are advantageous for small-scale farming though the pitcher making is time consuming (Setiawan, 2000; Saleh, 2010; Abu-Zreig et al., 2006; Paredes and San Jose, 2019; Siyal et al., 2009). Ring emitter made of a perforated hose covered with a specific garment can release the water sucked by plantŌĆÖs roots (Saefuddin and Saito, 2019; Saefuddin et al., 2019; Sumarsono et al., 2018).
Evapotranspirative irrigation (ETI) is another new type of irrigation technique that has been developed (Ardiansyah et al., 2019; Agustina, 2021; Arif et al., 2022). In principle, ETI uses ET energy to maintain the water level below, that through capillarity supplies the water to the rootzone. Herewith, any decrease in the water level will be balanced immediately with the same volume of incoming water controlled by a mechanical bulb-valve. The mechanism is self-regulated and use no electricity. Some results, in small plots, show ETI can increase water productivity over 14.5% without reducing rice yield (Agustina, 2021; Arif et al., 2022) and was proven water-efficient and inexpensive to cultivated water lettuces (Muharomah et al., 2021).
This study aimed to come up with a model of irrigation system that can supply the water immediately to meet ETc without utilizing electrical energy. Then the objective of this study is to derive the water balance model and obtain its performance tested to grow water lettuces.
Methodology
The study was conducted in the Department of Civil and Environmental Engineering, IPB University, Bogor, Indonesia on the latitude of 6┬░33'24.23"S, longitude of 106┬░43'33.4"E and altitude of 250 m above sea level. The field site has been equipped with an Automatic Weather Station (AWS). The average annual rainfall is over 3000 mm with the wet season commonly starts from September to February though some time longer until end of April. An outside experiment was done from November and December 2020 which was in the coincident with the rain season.
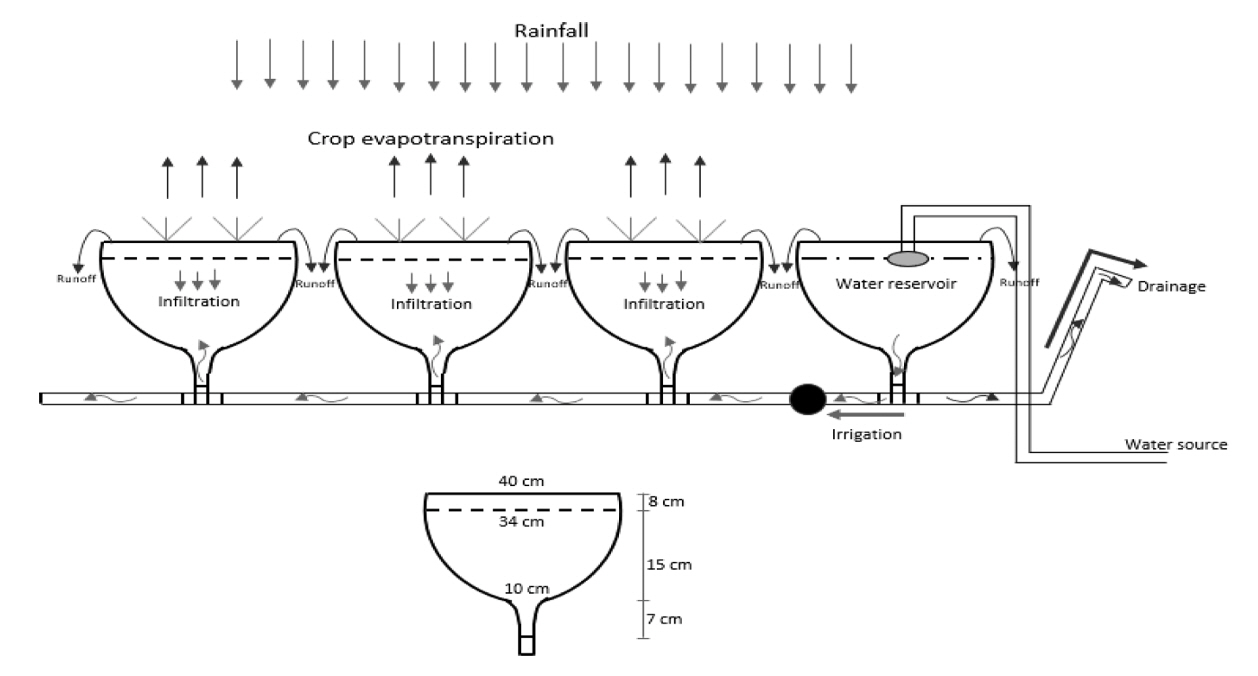
The subsurface ETI designed here (Figure 1) comprises a series of pots connecting each other with water hoses (1/2 inch diameter) through their bottoms (Muharomah et al., 2021). There are 15 pots formed like funnel with its upper and lower diameters are 40 cm and 10 cm, and height of 23 cm. The first pot was set as a reservoir that receives water from a tapped water through a mechanical water bulb-valve functioned to maintain its water level. While the last pot was equipped with an outlet to drain the excess of rainwater.
The other 13 pots were filled with planting media made of alluvial soil plus organic material and planted with water lettuces (Ipomoea aquatic) following the standard cultivation practice. The cultivation lasted 45 days in which every 15 days, parts of the plant, about 5 cm above the soil surface, were cut/harvested and the remains were left to regrow. The wet biomass was weighted and then oven-dried at 80┬░C for 3 days to get the dry biomass (Wd).
The water from the reservoir will immediately flow when the water level in the planted pots drop due to rootsŌĆÖ abstraction. Analog flowmeter was used to measure the waterflow and record every day around 06:00 GMT+7. Intermittent soil sampling in the surface soil using 100 mL ring sample was conducted to check the water content above the water level following the gravimetric method.
Referred to Figure 1, the water balance equation in volumetric unit can be written as follows:
Where V is water volume in the pots (cm3), R is the entering rainwater/infiltration (cm day-1), ETc is crop evapotranspiration (cm d-1), Ap is the area of soil surface (cm2), Q is irrigation (cm3 d-1), D is drainage (cm3 d-1), P is precipitation (cm d-1), Kc is the crop coefficient, ETp is the potential evapotranspiration (cm d-1), RO is runoff (cm d-1), H is the water level in the pot (cm), Hp is the highest water level (Hp = 30 cm), i is pot number (i = 1, 2, ... n, n = 14), and t is time (d) with Ō¢│t is the time interval (d).
Considering the pot is in the form of a funnel, the volume of water is calculated as follows.
Where r is the radius of the cone at H (cm), R0 and h0 are constants each 34 cm and 22 cm, h is the water level in the saturated soil layer (cm), ╬Ė is the volumetric water content in the unsaturated soil layer (cm3 cm-3), and Z is the depth of the unsaturated soil layer (mm).
As Q and D were measured in the first and the last pot and with the inclusion of water status in the plant, Eq. (5) can be expanded as follows:
Where VT and Vb are the volumes of total water (cm3) and water in the biomass (cm3). The potential ET (ETp) was calculated using Hargreaves model as follows.
In which, Ta is the average temperature (┬░C), and Rs is the solar radiation (MJ m-2 d-1), and C = 0.0135 (Muharomah et al., 2020). The crop coefficient (Kc) was calculated by mean of optimization process using the Solver in MS Excel to minimize the absolute error (╬Ą) of Eq. (5) in the following form (Arif et al., 2019):
Results and Discussions
1. Microclimate Condition
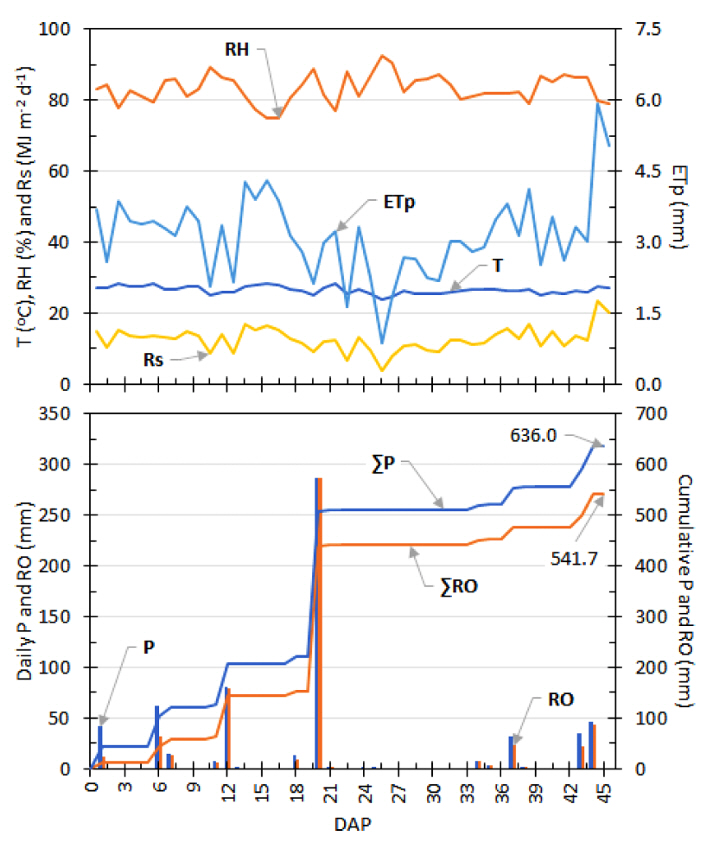
Figure 2 shows the microclimate consists of the average temperature (T), the average relative humidity (RH), the daily solar radiation (Rs) and the daily potential evapotranspiration (ETp) calculated using Eq. (13). The daily temperature (T) varied from 23.9┬░C and 28.5┬░C with the average value of 26.6┬░C in 45 days. This range was fairly within the favorable temperature for water lettuce, which is between 20-28┬░C. However, the maximum daily temperature varied from 26.6┬░C to 35.9┬░C. These high temperatures (>35┬░C) will cause momentarily wilts (Chowdhury et al., 2016; Haditiya and Prijono, 2018). While the average humidity varied between 74.9% and 92.6% with the overall average was 83.2%. This range of RH is also above 80% which is favorable for the plant growth. Solar radiation (Rs) varied between 3.7-27.4 MJ m-2 d-1 with the average was 13.0 MJ m-2 d-1.
Potential evapotranspiration (ETp) fluctuated abruptly in the range of 0.9-6.9 mm with the average value of 3.2 mm. This range is not far from the data reported earlier between 3-5 mm/d by Muharomah et al. (2020), Hasanah et al. (2015), Hasanah et al. (2017), Diansari et al. (2019), Amalia et al. (2020), Dewi et al. (2020b), Dewi et al. (2020a).
Precipitation (P) frequently occurred with the highest value reached 287 mm in 20-DAP (Dec 1st, 2022) and its cumulative (╬ŻP) amounted to 636 mm. Most of the precipitation overflowed as run-off (RO) accumulated to 541.7 mm (85%). Thus, it was only a small fraction (15%) of the precipitation infiltrating into the soil layers.
2. Water Balance Components
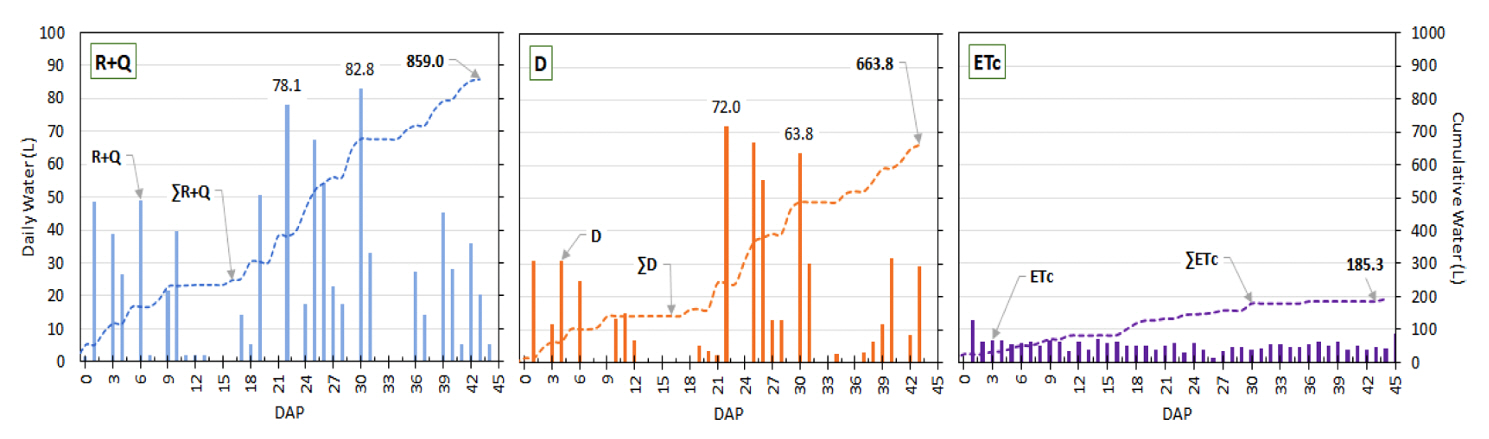
Figure 3 shows the daily and cumulative rainwater plus irrigation, drainage and potential evapotranspiration. These water components fluctuated with time and were highly influenced by the rainwater (R). The water that entered the soil (R+Q) was 859 L dominated by rainwater (R) amounted to 857 L (99.8%). While irrigation water (Q) contributed only 1.9 L (0.2%). Most of the rainwater instantly drained (D) accumulated to 663.8 L (77.3%).
Rainwater (R) was defined here as precipitation (P) minus run-off (RO). Run-off occurred when the precipitation exceeded 82.8 L with its intensity 0.051 m/d. The soil percolation rate might be less than this intensity. This value was sufficiently higher capable to drain the rainwater by gravity as the drainage (D) appeared almost instantly following the rainfall events. Herewith, the drainage coefficient or ratio [D/(R+W)] fluctuated once to reach 96% with the average was 29%. This high response of the drainage is deemed beneficial to demonstrate the leaching capability of the soil. For subsurface irrigation, leaching capability is important to prevent salt accumulation on the soil surface because of salinity process. Salt accumulation would increase the soil electrical conductivity (EC) and deter plant growth.
The other parts of the water were stored in the soil layers 9.8 L (1.1%) and consumed by the plant as the crop evapotranspirations (ETc) 185.3 L (21.6%). This value was lower than that of Diansari et al. (2019), where they used floating pots and resulted in 243 L for 3 harvestings. Reduced water use was also reported by Arif et al. (2021) which could enhance land and water productivities.
Irrigation water (Q) functioned mainly to return the water level to the set position when it decreased due to the water consumption by the plants or crop evapotranspiration (ETc). With no rainwater (R=0), this apparatus can be used to estimate the crop evapotranspiration (ETc) or functionalized as a lysimeter (Casanova et al., 2009; Dom├Łnguez-Ni├▒o et al., 2020) and furthermore to determine the crop coefficients. Herewith, given R=0 then simply ETc=Q.
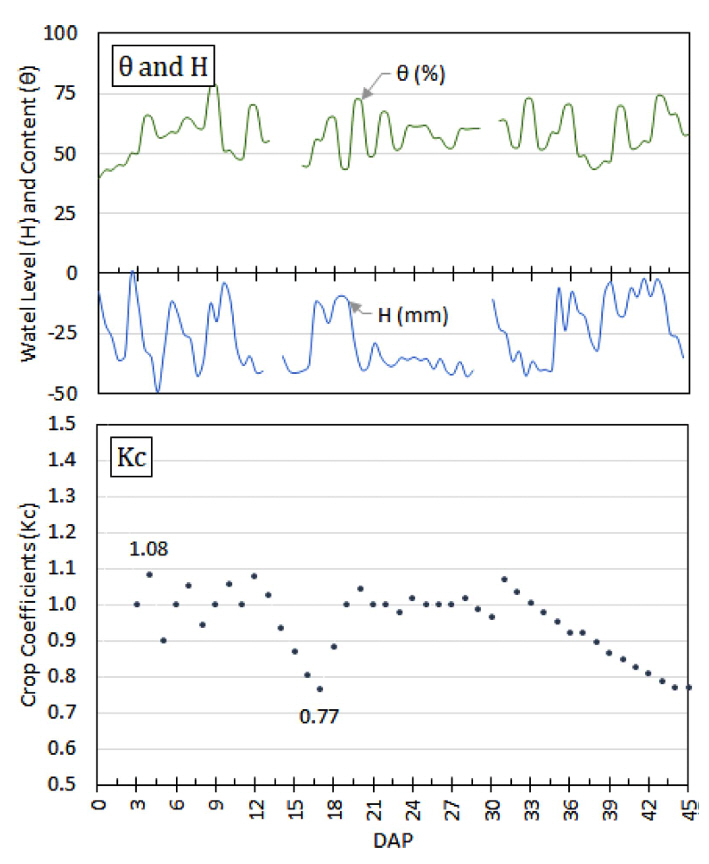
Figure 4 shows the water level (H) in the soil layer and saturation degree (S) of the soil above H. In this experiment, the water level was set 25 mm below the soil surface. Here, H varied with time in the range of 0.36-49.5 mm with the average value 26.6 mm. This considerably slight deviation indicating that this irrigation system was capable to keep the water levels within the tolerable range. Furthermore, the soil saturation degree was between 39-78% with the average value 58%. Thus, the surface soil remained unsaturated with water unsimilar to hydroponic (Dewi et al., 2020) and floating techniques (Diansari et al., 2019).
As shown also in Figure 4, crop coefficient (Kc) resulted from the optimization process (Eq. 14) varied with time. Here, Kc varied between 0.77-1.08 and decreased steadily from 1.1 to 0.77 after 30 days after planting (DAP). It is noticeable Kc was lower when there was no rainfall in the period of 12-21 DAP. These values of Kc for water lettuce are not far from those reported elsewhere (Allen, 2003; Allen and Pereira, 2009).
3. Yield, Water Productivity and Water Use Efficiency
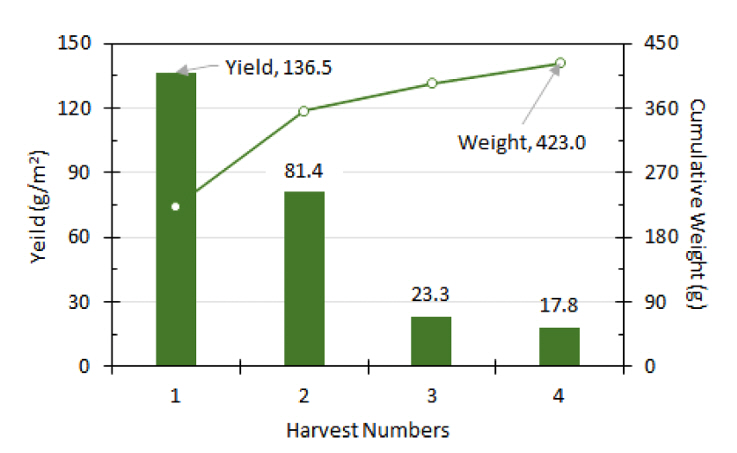
Figure 5 shows the yield and cumulative weight of the cut biomass from 4-time harvestings. Yield measured as the total oven-dried biomass divided by the whole surface area. The dried biomass (W) accumulated to 423 g while the yield decreased with the subsequent harvesting from 136.5 g/m2, 81.4 g/m2, 23.3 g/m2 and 17.8 g/m2. The overall yield was 258.9 g/m2. Furthermore, economical water productivity (WPE) was 2.17 g/L, physical water productivity (WPP) was 2.28 g/L, and water use efficiency (WUE) was 95%. The WPE is not far from the results reported earlier 2.4 g/L by Muharomah et al. (2020) and 2.2 g/L by Dewi et al. (2020) in greenhouses with different techniques.
Conclusions
A new non-conventional irrigation technology named Evapotranspirative Irrigation (ETI) model has been developed and tested, and it can work well for crop cultivation. The system consisted of 15 pots connected in serial using water pipes and hoses through the bottoms of the pots. The first pot was used as water level controller and the last pot used as drain water collectors. Irrigation water could flow immediately to the pots when the water level there lower than the setting level. The water level in the pots could be maintained within the expected range while the soil moisture above was kept in unsaturated conditions. The yield, water productivity, and water use efficiency in this technology can reach higher values compared to conventional methods. Further tests however are still needed which currently underway toward the dry season.
 PDF Links
 PubReader
 ePub Link
 Full text via DOI
 Download Citation
 Print
Print