

Introduction
With significant natural gas, oil, and coal deposits, Uzbekistan is a resource-rich nation. 91.3 percent of the primary energy produced was natural gas. The 19th-largest proven reserves of natural gas are found in Uzbekistan. Over the past ten years, the annual production of natural gas ranged from 54.1 to 66.0 bcm. The majority of the 61.6-terawatt hours (TWh) of energy produced in Uzbekistan in 2019 came from natural gas. Future projections indicate that the percentage of energy produced by coal will rise to 10% from the present 3%. 11 thermal power plants (TPPs), including 3 combined heat and power facilities, are the primary generators. TPPs were in charge of 89.6% of all power produced in 2019.
The increase in power output from 2010 to 2019 was 22.4% in the country, which was comparable to the 21.1% increase in population during the same time period. The main fuel used to produce electricity is natural gas. Despite an increase in overall production, there was still a gap in meeting total power demand from 2012 to 2019 of 9.4%, according to government figures. Imports, which accounted for 5.5% of total generation in 2019, help to fill a portion of the electricity deficit (Jebli, 2020).
Similar to border countries, Uzbekistan has a parallel energy grid. To boost its energy sector, Uzbekistan has been pursuing extensive reforms recently. High levels of equipment degradation, a slow pace of infrastructure updates, improper equipment operations, poor installations, and both gas pipelines and electrical lines that have reached the end of their useful lives are all related with problems. The nation's precarious financial state and the poor adoption of resource-and energy-saving technologies have increased technological losses and increased the frequency of disruptions in the delivery of fuel and energy resources (Apergis et al., 2023).
The nation has an enormous potential for solar energy, but none at an industrial scale. Additionally, there aren't any industrial-scale wind farms because the wind's potential hasn't been fully investigated. To create a legislative foundation for the growth of this energy sector, Uzbekistan is however taking action. More than 80% of Uzbekistan's GHG emissions come from the energy sector and the burning of fossil fuels (coal, natural gas, and oil), and in recent years, the proportion of greenhouse gases from fuel combustion has decreased from 71% to 59%. 2018 saw the ratification of the Paris Agreement by Uzbekistan, along with a national pledge to cut GHG emissions in terms of GDP by 10% below the level of 2010 by 2030.
The energy industry is a rapidly changing and complicated system by nature since it consists of numerous components with intricate cause-and-effect interactions created by numerous feedback loops. The system also includes numerous stakeholders with various management goals and interests, a variety of supply sources, and sophisticated usage. Additionally, it is impacted by variations in demand, changes in energy policy and socioeconomic-ecological systems, political instability, natural disasters, and variables related to energy dependence. Because of the interaction of these elements, energy planning and management must make decisions in the face of uncertainty, which presents numerous difficulties for the sector's sustainable growth. Among these are the rising demand for energy, the depletion of fossil fuels, the dangers of contamination from energy carbon emissions, and global warming (Barak and Sadegh, 2016).
Dynamically complex systems' behavior is determined not by the quantity of their parts, but rather by the interactions that take place between them as a result of built-in feedback loops (Laimon et al., 2020). But a lot of feedback loops are usually dormant and far from the initiating events (MacKay, 2011; Warbroek et al., 2018). As latent feedback loops become activated as a result of system shocks, this indicates that the behavior of complex systems can change in the future. System dynamics approach would be beneficial to analyze the dynamics and complexity of the energy sector since it places an emphasis on capturing the causal structure (using a causal loop diagram) and formulating equations (in a quantitative model) for each cause and effect relationship (Stagl, 2006).
Many dynamically complicated challenges, such as resource shortages and energy transitions, ecological and environmental systems, safety, and security, can be addressed using system dynamics (Blakers et al., 2017). Despite significant research into the energy industry, this novel strategy for figuring out how to relate energy structure, economics, and the environment is not being widely used (Elliston et al., 2012). This study goes beyond merely addressing a gap in the literature; it also makes a positive contribution by building a practical model that can be applied globally, suggesting policy interventions and forecasting future changes and CO2 emissions contributions. The paper's objectives are to establish a system dynamics model of the energy sector, create potential development scenarios for the energy sector in Uzbekistan, and utilize the system dynamics model to assess the scenarios.
Methodology
1. Conceptual model
Understanding how different elements of a system interact with one another is a process known as system thinking. It is a method of issue solving wherein rather than responding to a specific component, "problems" are seen as components of a larger system (Fraser et al., 2023). A system thinking-based paradigm called system dynamics is used to comprehend and describe the behavior and operations of complex systems through time (Johnson et al., 2020). System dynamics makes use of a variety of control elements, like feedback loops and time delays, to examine how the system responds to and behaves in response to trends. It can help policy and decision makers in situations when a system's actions are complicated and dynamic.
The stages of the system dynamics methodology are shown in Figure 1. As all stages strive to provide input for system knowledge, "system understanding" is the main focus of system dynamics. The initial phase of system dynamics research involves defining and identifying problems. At this point, it is important to be clear about the problem's current state and the project's goals. Data and knowledge, experiences, and judgments make up this stage's resources. The second stage, known as system conceptualization, entails setting boundaries, identifying causal relationships, and developing a framework for policies (qualitative analysis) and it is followed by causal loop diagrams. A diagram that depicts how interrelated variables influence one another is known as a causal loop diagram (CLD). The diagram is made up of nodes (variables) and the arrows that connect them (Sterman, 2000).
The latter steps place a focus on quantitative modeling, which is used to create computer models that mimic the dynamic relationships between the components, which is the area of system dynamics. In this work, causal loop diagrams were used to create a conceptual model of the energy sector in Uzbekistan utilizing the first three steps. A CLD is a graphic representation of the system's map. It consists primarily of three essential elements: variables, arrows showing the causal relationships among the variables, and time delay between the variables. Reinforcing (R) or balancing (B) feedback loops are shaped by the causal connections between variables. Positive feedbacks like R loops amplify changes (such exponential growth or decline), whereas negative feedbacks like B loops stabilize system behavior over time (Morecroft, 2015).
A linear system model would comprise an input, a process, and an output. The input and output of this kind of a system are separate from one another; the value of the present input is not influenced by the preceding output, nor is the next one impacted by the current input. In real life, the current input variables are influenced by prior outcomes. A feedback loop is the state in w hich an outcome of a system has an impact on the input as a result of a reciprocal process of cause and effect. Several major connected steps have been used in this study to construct the CLD. Such as by studying the literature, media reports, and policy papers in the first stage, we highlighted the major concerns facing the energy sector in the socalled variables. By creating connections, polarities, and a time delay between the variables in the second stage, these variables have been leveraged to create an initial CLD. In order to build a functional CLD, the initial CLD was modified and validated in the third stage with the help of industry specialists.
2. Strategies for intervention
The dynamics, connections, and relationships of dynamically complex systems can be understood through CLDs, as was before mentioned. Although these areas of power are difficult to locate and are not obvious, it can also be used to discover leverage points and actions that could result in long-lasting changes in the entire system (Lin et al., 2020). System archetypes, however, can show leverage points once they are recognized. A wide variety of systems' common behavior can be explained using system archetypes. In order to alter the behavior of the system, the limiting elements must be identified and changed (Senge et al., 1994).
Results
1. The theoretical framework for the electricity production in Uzbekistan
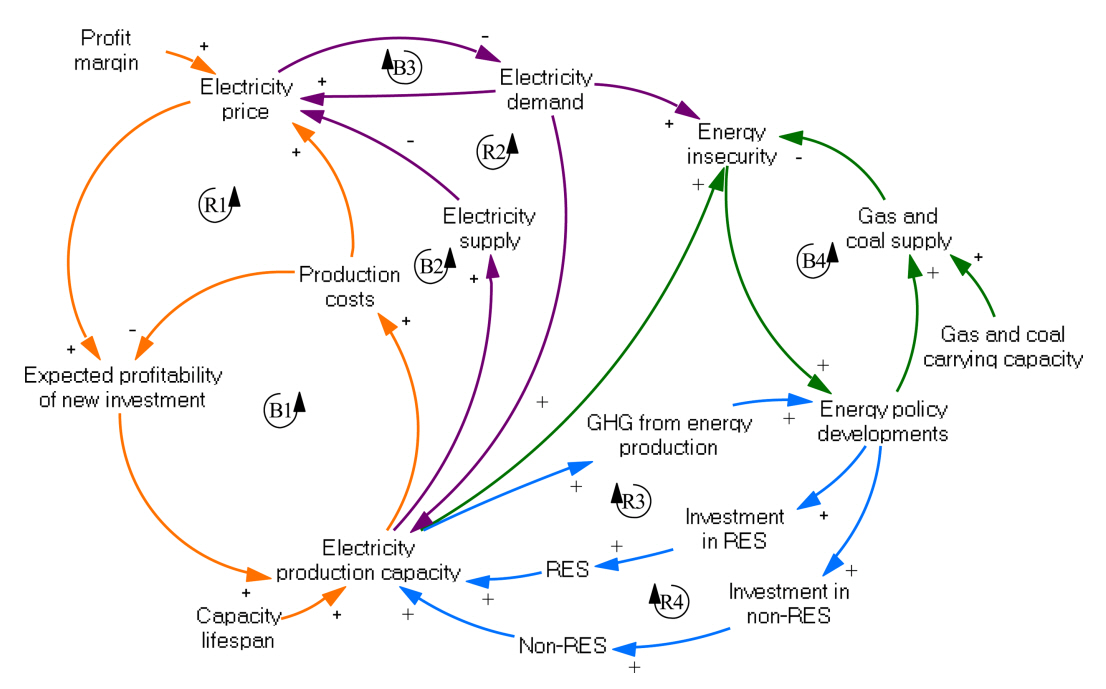
Figure 2 depicts the final CLD for the energy sector in Uzbekistan, which consists of four balancing loops (B1 to B4) and four reinforcing loops (R1 to R4) (Table 1). The CLD illustrates the relationships between the main energy sector elements, including energy sources, electricity production, demand, investment in renewable energy sources (RES) and energy policies. The next sections give a description of these loops.
2. Overview of the theoretical framework for the electricity production in Uzbekistan
2.1. Production costs loop
The interactions between production costs, expected profitability of new investment and electricity production capacity represent production cost loop B1 (Figure 2). An increase in production costs leads to a decline in expected profitability. Meanwhile, increase in expected profitability eventually causes a decline in electricity production capacity through an investment decision both on renewable and non-renewable energy.
2.2 Electricity supply, demand and price loops
Loop B2 shows the interactions between electricity supply, electricity price, expected profitability of new investment, electricity production capacity (Figure 2). Strong energy revenues may encourage investment, but they can also result in overcapacity and increase in supply, which could cause prices to fall (R1), lower energy revenues, or even a negative return on investment. The balancing loop B3 represents the electricity demand and highlight the contribution of energy security, production capacity and price.
2.3 Gas and coal supply loops
An increase of natural gas and coal supply leads to a decline in energy insecurity which entails decline in energy policy developments.
2.4 Electricity production through RES and Non-RES loops
Loops R3, R4 and R5 in Figure 2, highlight the impact of renewable energy sources (RES) and non-renewable sources of electricity production and its contribution to electricity production capacity and GHG emissions. Current global warming trends endanger human health and economic development, and Uzbekistan is one of the countries most sensitive to climate change. Ratifying the Paris Agreement binds the government to specific duties, such as decreasing GHG emissions and drawing more financing to modernize infrastructure and enhance energy efficiency. Reducing GHG emissions, raising the proportion of renewable energy in total energy consumption, and meeting rising energy demand are all part of many nations' renewable energy targets today. Additionally, Uzbekistan is creating goals to advance renewable energy sources and raise its contribution to the global energy balance. It specifically intends to raise the proportion of renewable energy in overall electricity production from around 10% in 2018 to 20% by 2025, including increasing the percentage of hydropower plants from 10% to roughly 16%, solar energy from 1.9% to 2.3%, and wind energy from approximately 1.4% to 1.6%.
3. Systems through the lenses of archetypes
From straightforward tools like causal loop diagrams to more sophisticated tools like computer simulation models and learning environments, systems thinking offers a variety of methods for obtaining better understanding of issues. The common events in systems thinking dynamic events that recur frequently in various contexts are captured through a class of tools known as systems archetypes. They are effective diagnostic instruments for pinpointing high-impact interventions that will bring about fundamental change.
As illustrated in Figure 2, the first system archetype that occurs in the model of the Uzbek electricity production sector is the growth and underinvestment archetype, which is made up of reinforcing loops (R1, R3, and R4) and balancing loops (B1 and B2). According to loops R3 and R4, the total expansion of RES and non-RES in Uzbekistan is what is causing the increase in energy output. Investors are encouraged to invest in more capacity by an increase in predicted profits. As loops B1 and B2 demonstrate, this expansion has a limit, so when it is reached, there is an excess of supply and a potential price fall. It might result in lower energy revenues, lower profitability, and a consequent decline in investment in new capacity. When the electricity price is lower than the cost of producing electricity, production capacity collapses. Reducing the limiting factor in loops B1 and B2 by regulating changes in manufacturing cost and supply rings the system back into balance and prevents excessive losses. Growth and underinvestment is a specific example of the limits to success archetype because of the propensity to underinvest in the face of growth.
The second system archetype that can be noticed in the model is a fixes that fail structure consists of a balancing loops that attempts to produce a certain outcome but is thwarted by a sneaky reinforcing loop. The interaction between these loops causes the reinforcing loop's actions to eventually undermine the desired outcome that the balancing loop first achieved. In Uzbekistan, energy uncertainty is a critical issue for sustainable energy. The government's rapid response is to expand natural gas supplies to meet short-term needs (balancing loop B4). However, one unforeseen consequence of this effort has been increasing long-term energy insecurity. This intervention raises the likelihood of supply interruptions induced by increased reliance on natural gas. Furthermore, rising local and international gas supplies will have an influence on gas reserves, reducing long-term energy security.
Discussion
The sector's sustainability is critical for ensuring growth in the economy and advancement in society (Saidov, 2021). It is widely acknowledged that policymakers and energy managers confront with ever-changing decision sets triggered by multifaceted interactions in systems, unpredictability, and conflicting stakeholder perspectives on sustainable energy production. Nonetheless, these judgments frequently focused on a single component of a larger whole, rather than the complete complicated energy system . Furthermore, decisions made according to expectations to analyze the present situation, predict prospective consequences, and decide how to affect the future may not necessarily yield intended long-term outcomes.
The alignment of stakeholder perspectives and the provision of decision-makers and energy managers with the necessary knowledge and skills to make sound decisions are critical for the success of efforts to build the long-term viability of the energy sector. The potential failure to deliver the required sustainable results is one of the risks of oversimplifying an issue and neglecting the value of interconnectedness across energy sector components. We have created a synthesis of qualitative modeling tools by systems thinking. The insight they provide may aid a wide range of policy makers and stakeholders in respect to the sustainability concerns facing the industry. The CLD diagrams provide us a unique perspective on how business and society work by illustrating how things are related to one another and how changes in one area of the system may have an impact on other areas and then have the opposite effect.
The interconnectedness of the universe is frequently claimed, yet there is no other way to convey its complexity but through language. The links between the factors made clear and visually via simple causal loop diagrams. In addition, they can be utilized to generate and record the mental models of specific persons or groups and to broaden people's perspectives beyond the confined. But there's more than simply links. Causal loop diagrams can also depict theories regarding dynamic behavior. Here is where the mental change that is so essential to the concept of feedback systems begins. Any organization's structure, the web of compensating and reinforcing feedback loops that propel performance through time, heavily influences how that organization will evolve over time.
This significant philosophical idea is embodied by causal loop diagrams, which clearly show the significant feedback loops thought to be accountable for observed outcomes (Karimov, 2023; Perlow et al., 2002). The concept of feedback systems goes beyond simple feedback loops. It is equally crucial to recognize that many feedback processes are practically unnoticed in daily life. They manifest themselves through unexpected outcomes, unexpected resistance to change, and unexpected negative effects.
Some of the main issues facing the nation include its high GHG emissions, depletion of energy resources, and growing energy dependence. Uzbekistan intends to boost the proportion of RESs in total energy generation to more than 25% by 2030, as stated in the Strategy on the Transition of the Republic of Uzbekistan to the "Green" Economy for the Period 2019-2030. Additionally, it intends to double the energy efficiency, lower the GDP's carbon intensity, and provide the population with access to contemporary, reasonably priced, and dependable energy across all economic sectors. The low energy rates, which are highly subsidized by the government, are one of the main obstacles impeding general efficiency of energy advances and the introduction of energy-saving initiatives in Uzbekistan. According to a Ministry of Energy study from March 2020, the average cost of producing one-kilowatt hour of energy was 0.04 USD/kWh, which is about 37% more expensive than the average residential tariff of 0.04 USD/kWh. The state provided a subsidy for the difference. The total amount of subsidies between 2010 and 2019 was about USD 60 billion. Energy efficiency benefits the economy and the environment in addition to reducing costs and reducing greenhouse gas emissions. It also leads to advances in public health and the environment (Allaev et al., 2023).
A plan for implementing the Uzbekistan's Environmental Protection Concept through 2030 has been adopted by the nation. The Concept places a strong emphasis on environmental conservation in the energy industry. It draws attention to the unsustainable use of natural resources, without considering future development prospects. The oil and gas, mining, construction, metallurgy, and energy industries, along with motorized transportation, are the biggest contributors to air pollution in Uzbekistan. To draw investments in RE, a steady and consistent energy policy is essential, combined with technological advancement and innovation. Accelerated adoption of contemporary, cutting-edge technology in the economic, social, and other domains with extensive use of advancements in science and technology is a crucial prerequisite for Uzbekistan's dynamic development.
R&D expenses in Uzbekistan made for 0.1% of GDP in 2020. Compared to wealthy nations, Uzbekistan has substantially lower levels of R&D funding. By developing efficient mechanisms to combine education, science, and enterprise for the general introduction of research findings, experimental design, and technological work, the government hopes to increase the nation's scientific capacity and the efficacy of scientific R&D. The path to a sustainable energy sector can be paved by enhancing the feedback impact of electricity market signals, including information flows to feedback loops, concentrating on energy conservation, boosting investment in efficiency in energy use and renew able energy, and technology development and innovation, together with consistent and solid policy on energy.
Conclusion
With short fixes that do not address the ever-changing nature and complexity of the sustainability challenges facing the energy system, the old linear thinking paradigm results in only treating the symptoms. The use of systems thinking can help politicians and stakeholders to understand the connections among multiple interconnected subsystems of a system of electricity industry that influence its long-run dynamic behavior by focusing on how each of the system's components interact and how the system as a whole operates overtime and within the framework of wider systems.
Setting up a supply and demand balance, conserving resources, and lowering energy dependence and emissions are essential for a future powered by sustainable energy. A supplydemand equilibrium also supports continued economic expansion and meets energy needs; lowering emissions denotes a decreased reliance on fossil fuels. We discovered that the current growth of energy sector in the country is unregulated and is on a trajectory toward an unsustainable future. Our systems thinking perspective demonstrates that because of excessive mining of fossil fuels, high emissions, and high-energy dependence, carrying capacity is rapidly approaching.
As a result, the current scenario might be among the worst for the energy industry in Uzbekistan. The best-case scenario, however, might involve reducing reliance on fossil fuels and expediting the sw itch to renew able systems. In order for the energy industry to successfully address sustainability concerns, long-term thinking and strategies that are centered on important solutions must be implemented in order to more effectively identify and mitigate undesirable effects that arise from feedback of initiatives.

 PDF Links
 PubReader
 ePub Link
 Full text via DOI
 Download Citation
 Print
Print